I designed this worldwide interactive map, in near-monochrome, for use in data visualizations. It was a fun challenge to differentiate all the different types of map features with a limited color palette.
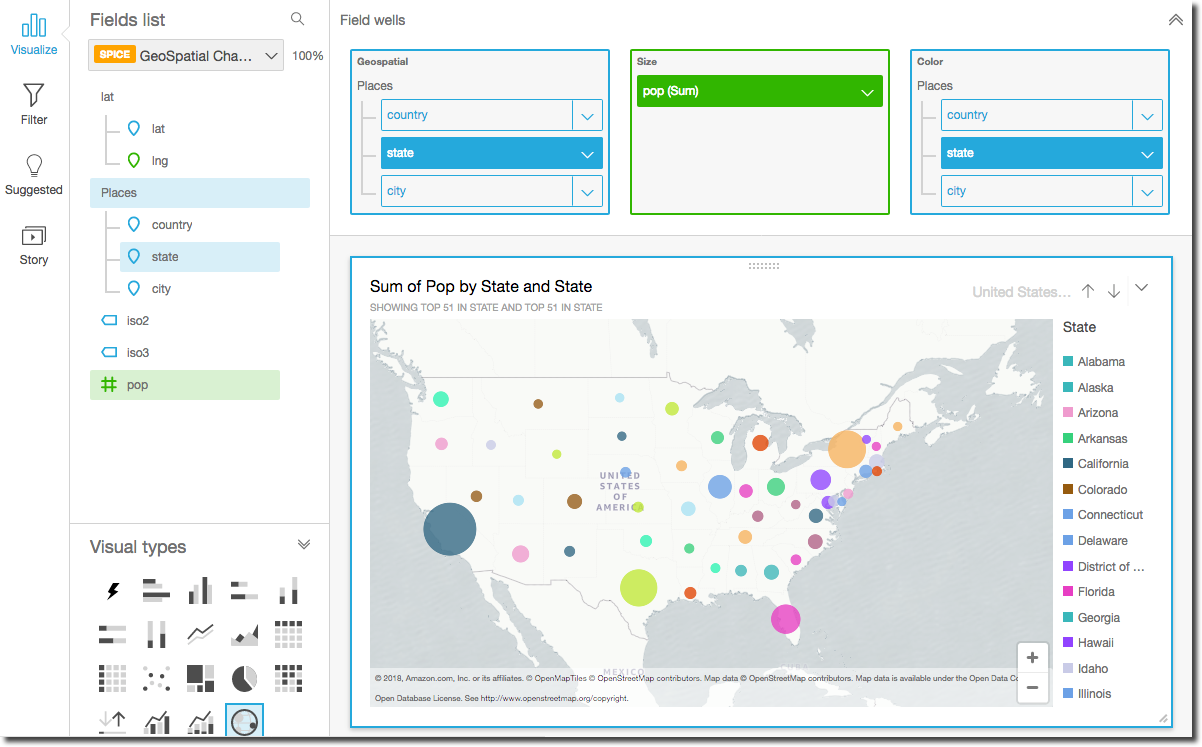
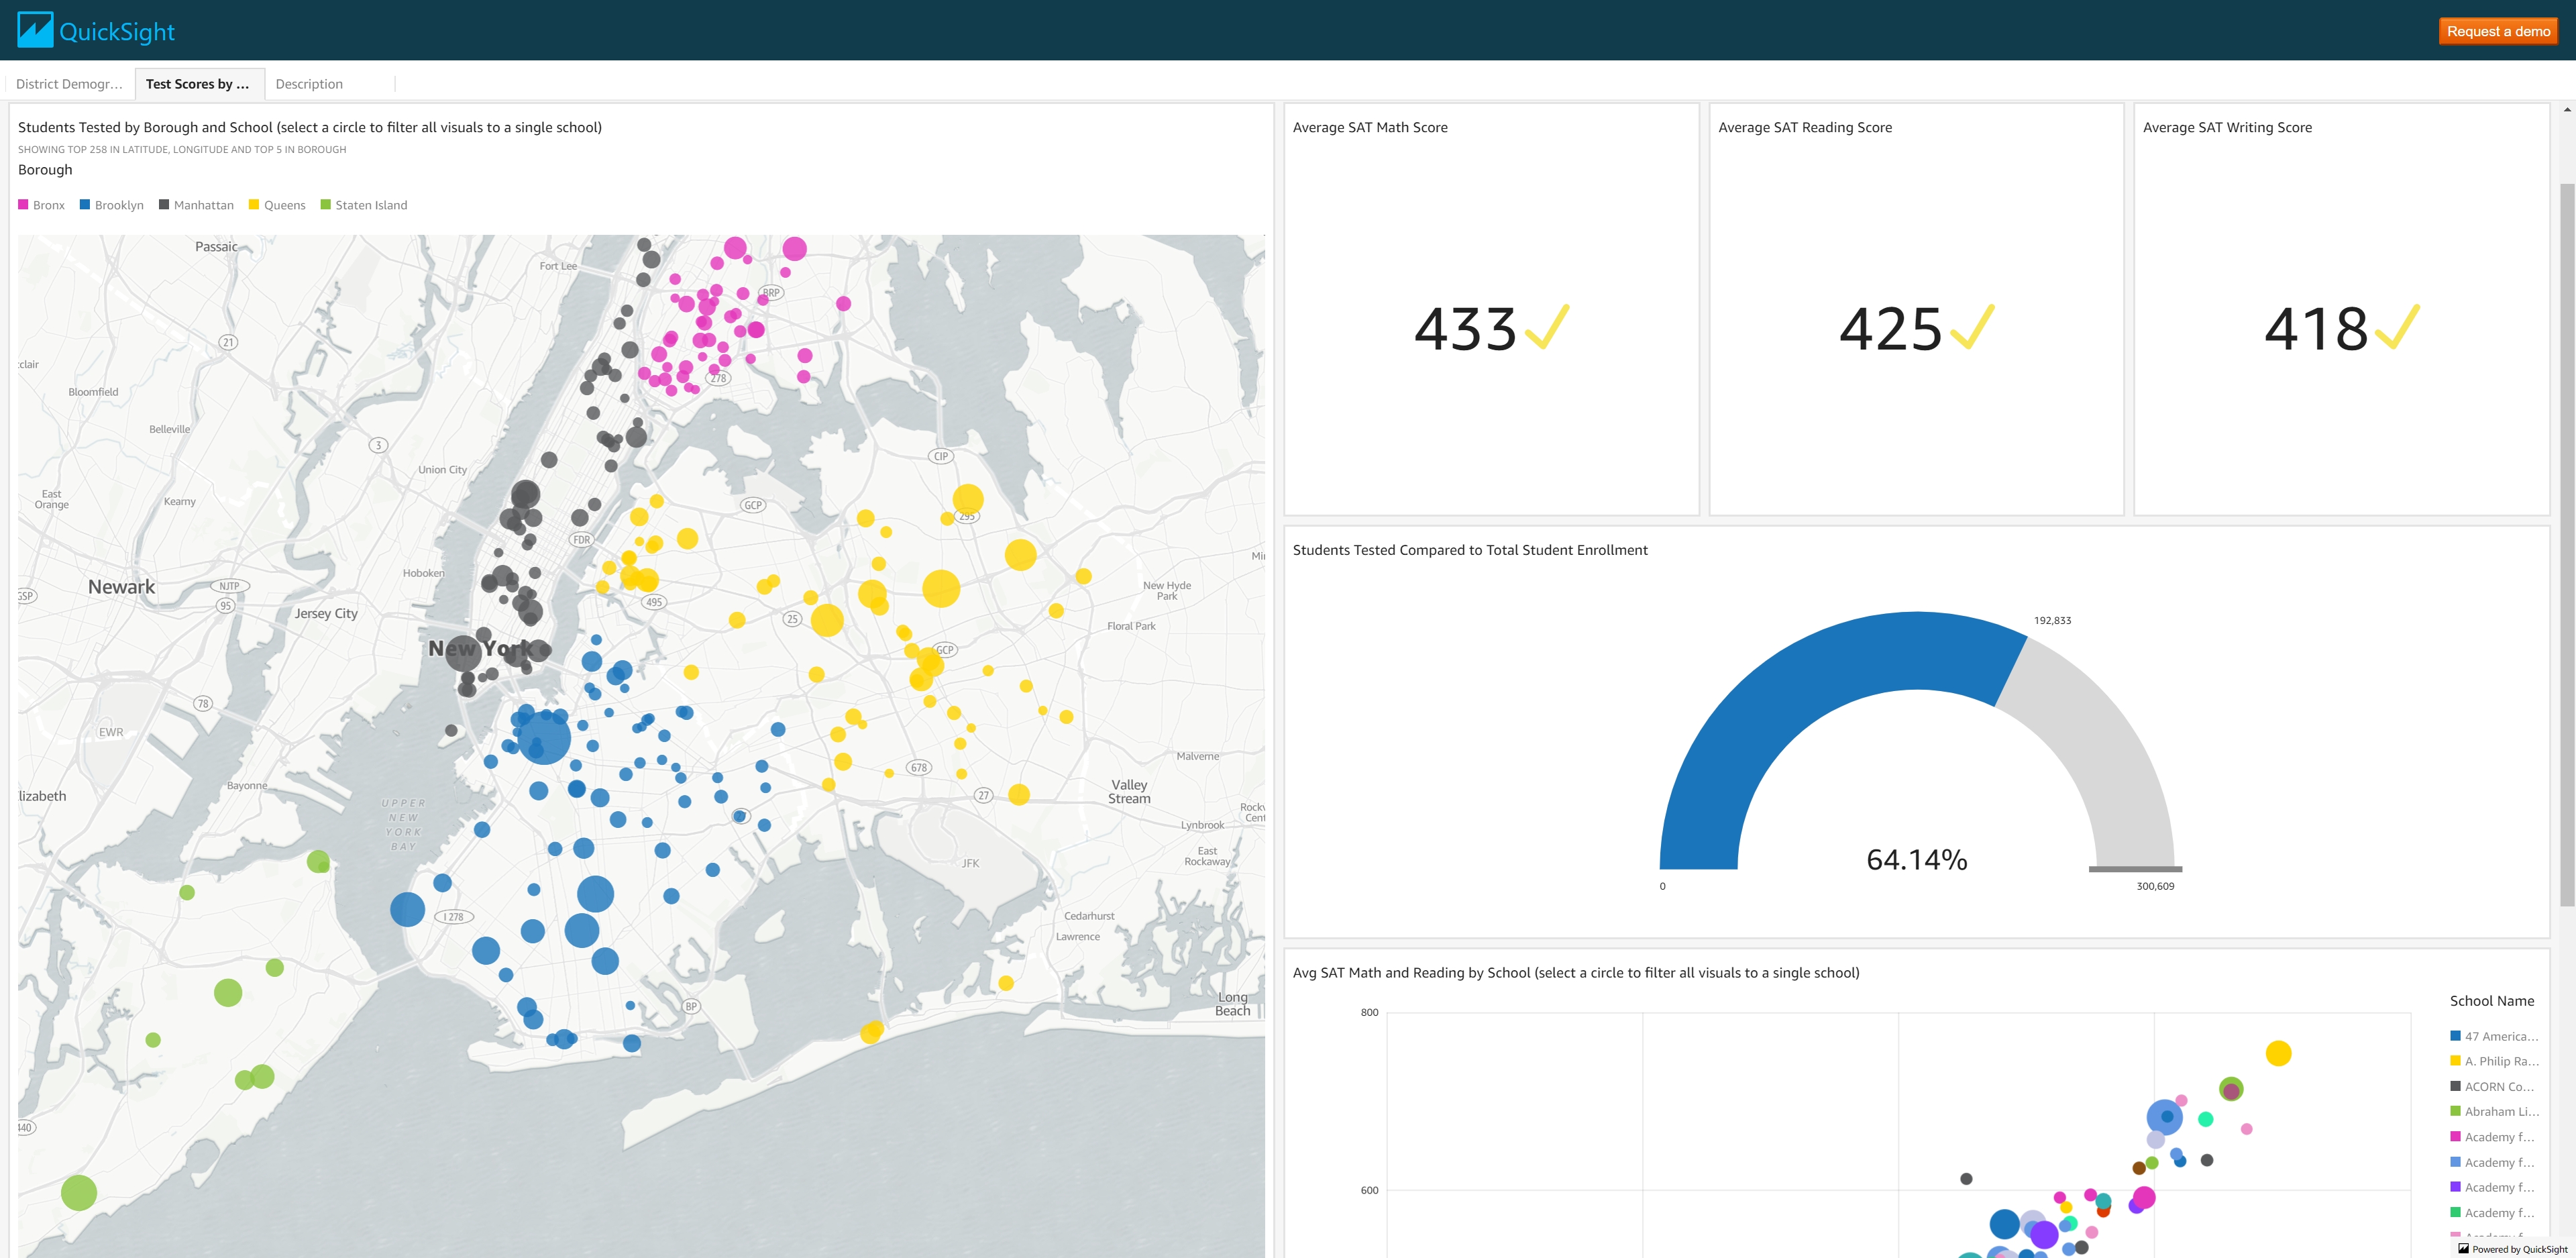
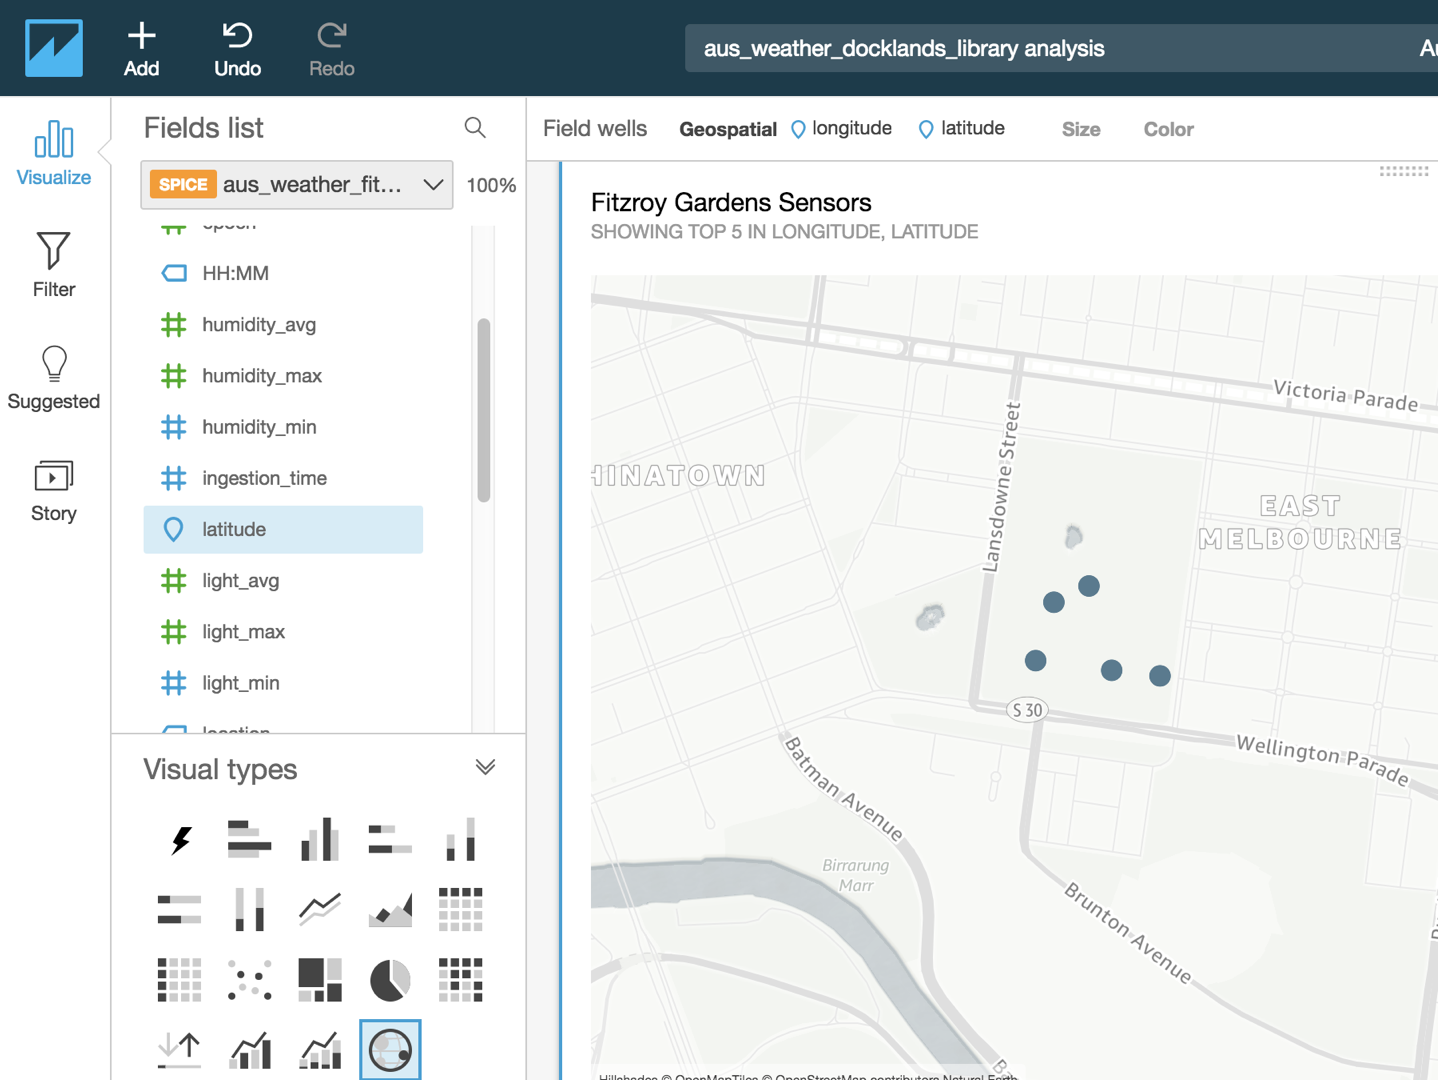
This map was used in several applications at Amazon, including AWS QuickSight.